深度学习之目标检测(十)YOLO如何使用k-means获得Anchor
本章学习 YOLO 如何使用k-means获得Anchor,学习视频源于 Bilibili,参考的 CSDN 博客包括:
所使用的代码参考的是 yolov3 spp 以及 yolov5 中生成 Anchors 的方法。
1. K-means 聚类算法
本小节参考 百度百科 进行讲解,k-means clustering algorithm 是一种迭代求解的聚类分析算法,其步骤是,预将数据分为 K 组,则随机选取 K 个对象作为初始的聚类中心,然后计算每个对象与各个种子聚类中心之间的距离(相似程度),把每个对象分配给距离它最近的聚类中心。聚类中心以及分配给它们的对象就代表一个聚类。每分配一个样本,聚类的聚类中心会根据聚类中现有的对象被重新计算。这个过程将不断重复直到满足某个终止条件。终止条件可以是以下任何一个:
- 没有(或最小数目)对象被重新分配给不同的聚类。
- 没有(或最小数目)聚类中心再发生变化。
- 误差平方和局部最小。
K-means 算法对初始种子点的选择比较敏感 (选择种子点比较好,则聚类较快,反之则比较慢)。K-means 聚类算法具体实现如下所示:
import numpy as np
import pandas as pd
import random
import sys
import time

class KMeansClusterer:
    def __init__(self,ndarray, cluster_num):
        self.ndarray = ndarray
        self.cluster_num = cluster_num
        self.points = self.__pick_start_point(ndarray, cluster_num)

    def cluster(self):
        result = []
        for i in range(self.cluster_num):
            result.append([])
        for item in self.ndarray:
            distance_min = sys.maxsize
            index=-1
            for i in range(len(self.points)):
                distance = self.__distance(item,self.points[i])
                if distance < distance_min:
                    distance_min = distance
                    index = i
            result[index] = result[index] + [item.tolist()]
        new_center=[]
        for item in result:
            new_center.append(self.__center(item).tolist())

        # 中心点未改变,说明达到稳态,结束递归
        if (self.points == new_center).all():
            return result

        self.points = np.array(new_center)
        return self.cluster()

    def __center(self, list):
        '''计算一组坐标的中心点
        '''
        # 计算每一列的平均值
        return np.array(list).mean(axis = 0)

    def __distance(self, p1, p2):
        '''计算两点间距
        '''
        tmp=0
        for i in range(len(p1)):
            tmp += pow(p1[i]-p2[i], 2)
        return pow(tmp, 0.5)

    def __pick_start_point(self, ndarray, cluster_num):

        if cluster_num < 0 or cluster_num > ndarray.shape[0]:
            raise Exception("簇数设置有误")

        # 随机点的下标
        indexes = random.sample(np.arange(0,ndarray.shape[0],step=1).tolist(), cluster_num)
        points=[]
        for index in indexes:
            points.append(ndarray[index].tolist())
        return np.array(points)
有两点需要进行注意:
- 如何定义样本之间的距离(相似程度)?虽然最常见的是欧氏距离,但是也要根据场景去设计。
- 如何确定 K 的取值?一共分为多少类,根据先验知识?根据场景?还是聚类过程中进行确定?
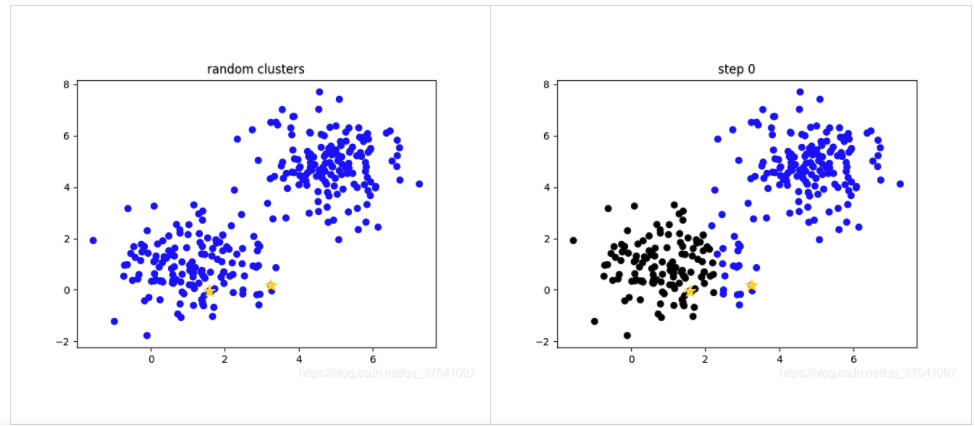
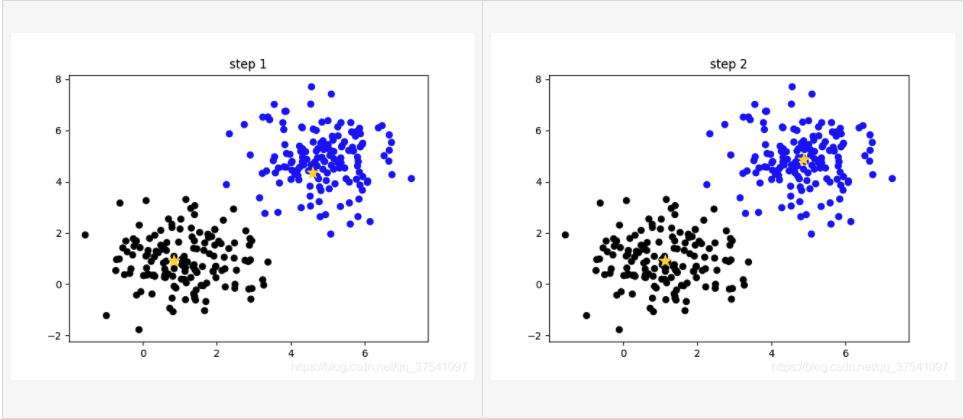
下图给出了 k-means 算法的运行示例,生成以下聚类过程图片的代码见:plot_kmeans.py。
2. YOLOv2 中的 K-means 算法
Faster R-CNN 使用的 Anchors 都是作者通过工程经验人为设计的, 但并没有给出设计的过程和细节。YOLOv2 论文中作者提到说:如果我们一开始就选择了合适的 Anchors,那么网络就更容易去学习如何进行好的预测。那如何评价什么是好的 Anchors 呢?YOLOv2 论文作者通过计算所有目标 GT boxes 与 Anchors 的最大 IOU 的均值作为指标,记为 Avg IOU, 其越大代表得到的 Anchors 越好。
The network can learn to adjust the boxes appropriately but if we pick better priors for the network to start with we can make it easier for the network to learn to predict good detections.
YOLOv2 中是怎么利用 k-means 聚类算法得到 Anchors 的呢 ? 作者对比了 k=5 和 k=9 的情况,最后为了计算量的取舍选择了 k=5。另一个核心问题是如何定义样本之间的距离。YOLOv2 论文中作者提到说:直接使用欧式距离其实并不好。因为衡量指标为 Avg IOU,所以选择 1-IOU(bboxes, anchors) 表示距离,如果 bbox 与对应的簇中心(Anchor)IOU 越大,则距离越近(1-IOU(bboxes, anchors)越小)。采用Cluster SSE (Sum of Square Error) 欧式距离误差平方和与采用Cluster IOU相比,后者对应的 Avg IOU 越大,效果越好。作者在 Anchors 个数为 9 的情况下对比 Cluster IOU 得到的 Avg IOU 比 Faster R-CNN 手工设计 Anchors 计算得到的 Avg IOU 更高。
If we use standard k-means with Euclidean distance larger boxes generate more error than smaller boxes.

下展示使用k-means算法,1-IOU(bboxes, anchors) 作为样本之间的距离进行聚类的代码示例,代码链接:yolo_kmeans.py:
- Step1: 在所有的 bboxes 中随机挑选 k 个作为簇的中心 (Anchors)
- Step2: 计算每个 bboxes 离每个簇中心的距离 1-IOU(bboxes, Anchors)
- Step3: 计算每个 bboxes 距离最近的簇中心,并分配到离它最近的簇中
- Step4: 根据每个簇中的 bboxes 重新计算簇中心 (Anchors),这里默认使用的是计算中值,自己也可以改成其他方法
- Step5: 重复 Step3 和 Step4 直到每个簇中元素不在发生变化
import numpy as np


def wh_iou(wh1, wh2):
    # Returns the nxm IoU matrix. wh1 is nx2, wh2 is mx2
    wh1 = wh1[:, None]  # [N,1,2]
    wh2 = wh2[None]     # [1,M,2]
    '''
    利用了 numpy 的广播机制
    将 wh1 第一个维度自动复制 M 次为 [N,M,2]
    将 wh2 第零个维度自动复制 N 次为 [N,M,2]
    '''
    inter = np.minimum(wh1, wh2).prod(2)  # [N,M]
    return inter / (wh1.prod(2) + wh2.prod(2) - inter)  # iou = inter / (area1 + area2 - inter)


def k_means(boxes, k, dist=np.median):
    """
    yolo k-means methods
    refer: https://github.com/qqwweee/keras-yolo3/blob/master/kmeans.py
    Args:
        boxes: 需要聚类的bboxes
        k: 簇数(聚成几类)
        dist: 更新簇坐标的方法(默认使用中位数,比均值效果略好)
    """
    box_number = boxes.shape[0]
    last_nearest = np.zeros((box_number,))

    # 在所有的bboxes中随机挑选k个作为簇的中心。
    clusters = boxes[np.random.choice(box_number, k, replace=False)]	# replace=False 采样的 k 个数值不会重复

    while True:
    	  # 计算每个bboxes离每个簇的距离 1-IOU(bboxes, anchors)
        distances = 1 - wh_iou(boxes, clusters)
        # 计算每个bboxes距离最近的簇中心
        current_nearest = np.argmin(distances, axis=1)
        # 每个簇中元素不在发生变化说明以及聚类完毕
        if (last_nearest == current_nearest).all():
            break  # clusters won't change
        for cluster in range(k):
            # 根据每个簇中的bboxes重新计算簇中心
            clusters[cluster] = dist(boxes[current_nearest == cluster], axis=0)

        last_nearest = current_nearest

    return clusters
3. YOLOv5 中的 K-means 算法
代码是 大佬 根据 YOLOv5 中聚类 Anchors 的代码修改得到的。主要的小改动了三点:1. 对代码做了些简化,更加易读;2.把使用pytorch 库的地方都改成了 numpy 库(也就方便搞到 Jittor 库了);3. 作者默认使用的 k-means 方法是 scipy 包提供的,且使用的是欧式距离。被改成了基于 1-IOU(bboxes, anchors) 距离的方法。YOLOv5 实际还不是直接使用欧氏距离的结果,而是经过了 Genetic Algorithm 遗传算法进行变异的结果。完整代码链接点击 此处。
代码流程如下:
- step1:读取训练集中每张图片的 w h 以及所有 bboxes 的 w h
- step2:将每张图片中 w h 的最大值等比例缩放到指定大小 img_size,由于读取的 bboxes 是相对坐标所以不需要改动
- step3:将 bboxes 从相对坐标改成绝对坐标(乘以缩放后的 w h)
- step4:筛选 bboxes,保留 w h 都大于等于两个像素的 bboxes
- step5:使用 k-means 聚类得到 k 个 anchors
- step6:使用遗传算法随机对 anchors 的 w h 进行变异,如果变异后效果变得更好(使用 anchor_fitness 方法计算得到的 fitness(适应度)进行评估)就将变异后的结果赋值给 anchors,如果变异后效果变差就跳过,默认变异1000次。
- step7:将最终变异得到的 anchors 按照面积进行排序并返回
代码链接:main.py。
import random
import numpy as np
from tqdm import tqdm
from scipy.cluster.vq import kmeans

from read_voc import VOCDataSet
from yolo_kmeans import k_means, wh_iou


def anchor_fitness(k: np.ndarray, wh: np.ndarray, thr: float):  # mutation fitness
    r = wh[:, None] / k[None]
    x = np.minimum(r, 1. / r).min(2)  # ratio metric
    # x = wh_iou(wh, k)  # iou metric
    best = x.max(1)
    f = (best * (best > thr).astype(np.float32)).mean()  # fitness
    bpr = (best > thr).astype(np.float32).mean()  # best possible recall
    return f, bpr


def main(img_size=512, n=9, thr=0.25, gen=1000):
    # 从数据集中读取所有图片的wh以及对应bboxes的wh
    dataset = VOCDataSet(voc_root="/data", year="2012", txt_name="train.txt")
    im_wh, boxes_wh = dataset.get_info()

    # 最大边缩放到img_size
    im_wh = np.array(im_wh, dtype=np.float32)
    shapes = img_size * im_wh / im_wh.max(1, keepdims=True)
    wh0 = np.concatenate([l * s for s, l in zip(shapes, boxes_wh)])  # wh

    # Filter 过滤掉小目标
    i = (wh0 < 3.0).any(1).sum()
    if i:
        print(f'WARNING: Extremely small objects found. {i} of {len(wh0)} labels are < 3 pixels in size.')
    wh = wh0[(wh0 >= 2.0).any(1)]  # 只保留wh都大于等于2个像素的box

    # Kmeans calculation
    # print(f'Running kmeans for {n} anchors on {len(wh)} points...')
    # s = wh.std(0)  # sigmas for whitening
    # k, dist = kmeans(wh / s, n, iter=30)  # points, mean distance
    # assert len(k) == n, print(f'ERROR: scipy.cluster.vq.kmeans requested {n} points but returned only {len(k)}')
    # k *= s
    k = k_means(wh, n)		# 比欧式距离的更好

    # 按面积排序
    k = k[np.argsort(k.prod(1))]  # sort small to large
    f, bpr = anchor_fitness(k, wh, thr)
    print("kmeans: " + " ".join([f"[{int(i[0])}, {int(i[1])}]" for i in k]))
    print(f"fitness: {f:.5f}, best possible recall: {bpr:.5f}")

    # Evolve
    # 遗传算法(在kmeans的结果基础上变异mutation)
    npr = np.random
    f, sh, mp, s = anchor_fitness(k, wh, thr)[0], k.shape, 0.9, 0.1  # fitness, generations, mutation prob, sigma
    pbar = tqdm(range(gen), desc=f'Evolving anchors with Genetic Algorithm:')  # progress bar
    for _ in pbar:
        v = np.ones(sh)
        while (v == 1).all():  # mutate until a change occurs (prevent duplicates)
            v = ((npr.random(sh) < mp) * random.random() * npr.randn(*sh) * s + 1).clip(0.3, 3.0)
        kg = (k.copy() * v).clip(min=2.0)
        fg, bpr = anchor_fitness(kg, wh, thr)
        if fg > f:
            f, k = fg, kg.copy()
            pbar.desc = f'Evolving anchors with Genetic Algorithm: fitness = {f:.4f}'

    # 按面积排序
    k = k[np.argsort(k.prod(1))]  # sort small to large
    print("genetic: " + " ".join([f"[{int(i[0])}, {int(i[1])}]" for i in k]))
    print(f"fitness: {f:.5f}, best possible recall: {bpr:.5f}")


if __name__ == "__main__":
    main()
运行结果如下,注意由于随机性每次结果都会有些差异,如果要能够复现,需要固定 numpy 以及 random 包的随机数种子。
read data info.: 100%|██████████| 5717/5717 [00:00<00:00, 6549.98it/s] kmeans: [12, 18] [27, 31] [33, 69] [75, 48] [65, 118] [125, 137] [164, 268] [299, 166] [382, 337] fitness: 0.73256, best possible recall: 0.99956 Evolving anchors with Genetic Algorithm: fitness = 0.7358: 100%|██████████| 1000/1000 [00:05<00:00, 182.22it/s] genetic: [13, 23] [34, 31] [30, 75] [79, 66] [69, 143] [142, 134] [169, 270] [331, 177] [391, 338] fitness: 0.73582, best possible recall: 0.99930
4. 细节提醒
如果有时使用自己聚类得到的 anchors 的效果反而变差了,此时可以从以下两个方面进行检查:
- 注意输入网络时训练的图片尺寸。这是个很重要的点,因为一般训练/验证时输入网络的图片尺寸是固定的,比如说 640 x 640,那么图片在输入网络前一般会将最大边长缩放到 640,同时图片中的 bboxes 也会进行缩放。所以在聚类 anchors 时需要使用相同的方式提前去缩放 bboxes,否则聚类出来的 anchors 并不匹配。如果你的图片都是 1280 x 1280 大小的,假设 bboxes 都是 100 x 100 大小的,如果不去缩放 bboxes,那么聚类得到的 anchors 差不多是在 100 x 100 附近。而实际训练网络时 bboxes 都已经缩放到 50 x 50 大小了,此时理想的 anchors 应该是 50 x 50 左右而不是 100 x 100 了。如果训练的图片不是固定尺寸的,那么就直接按照预处理方法的随机缩放对图片和 bbox 进行相同的处理就行了。
- 如果使用预训练权重,不要冻结太多的权重。当训练自己数据集时一般都是使用 COCO 等大型数据上公开的预训练好的权重。而这些权重是基于 COCO 等数据集上聚类得到的结果,并不是针对我们自己的数据集聚类得到的。所以网络为了要适应新的 anchors 需要调整很多权重,如果你冻结了很多层(假设只去微调最后的预测器,其他权重全部冻结),那么得到的结果很大几率还没有之前的anchors 好。当可训练的权重越来越多,一般使用自己数据集聚类得到的 anchors 会更好一点(前提是自己聚类的 anchors 是合理的)。
如果不是使用 1-IOU(bboxes, anchors) 作为距离指标,而是使用 GIoU,DIoU,或者 CIoU 呢?
瞎搞!现在的相似度距离计算没有位置,只有大小,所以他们都是不可用的。只有 CIoU 中关于长宽比的说法似乎还有点帮助!